Queue length studies is the mathematical study of waiting lines, or queues. In queueing theory, a model is constructed so that queue lengths and waiting time can be predicted. It is generally considered a branch of operations research because the results are often used when making business decisions about the resources needed to provide a service. Data collection is a critical task for any organization interested in financing a new project, developing a new project or looking to acquire a project. Queues are measured either in vehicles/ PCU’s or distance from the junction and can be recorded at various time intervals, although the most common are 5 minute and 15-minute intervals. TransAnalyst provides queue length data lane wise.
Queue lengths at the end of red trim (red-end) are of greatest importance for dimensioning the lengths of the lane at signalized intersections. While the average queue length reflects the capacity of traffic signals, the so-called 95th and 99th percentile of queue lengths at red ends are used for determining the length of turning lanes, such that the risk of a blockage in the through lanes could be minimized. Moreover, lengths of back-of-queue (queue length at the queue – end) must be considered for determining the lengths of turning lanes at signalized intersections. From Markov chains, The queue lengths and their distribution can be numerically calculated. The percentiles of queue lengths can be estimated from the distribution. Based on the results of Markov chains, regressions are undertaken for obtaining explicit formulas under stationary traffic conditions. For non-stationary traffic conditions, the formulas can be derived using the so-called transition techniques.
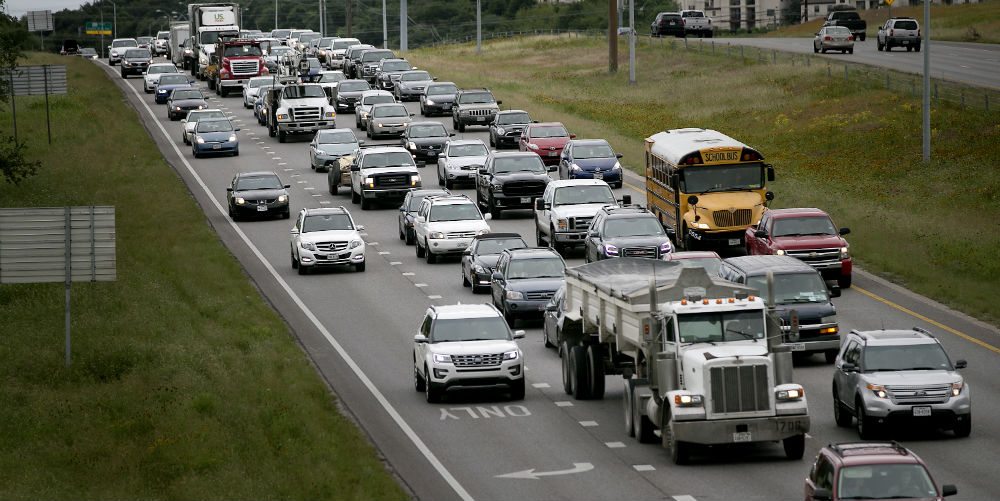
If a bus or heavy vehicle was present within the first 8 vehicles of the queue during a signal cycle, then a Queue was cast out. Two observers were assigned to each intersection, with each responsible for two approaches. During a one-hour period, each observer alternated fifteen minute periods between their two approaches. Analytic thinking Upon review of field sheets for accuracy, a common anomaly was noted. On several cycles , it was noted that the vehicles did not queue as expected. Examples include the following: · A vehicle would leave a space between the automobile in front equal to a car length for no ostensible reason. A vehicle would leave a space between the automobile in front equal to a car length to avoid blocking a driveway. The lead vehicle in the queue would pull up significantly beyond the STOP line.
Queue length Surveys provide detailed secondary information relating to the length of queues that vehicles on each arm are experiencing at a specific intersection at certain peak times of the day, it is a great accompaniment to an intersection count. As always, we undertake these surveys using HD Video Surveillance cameras. Depending upon the client’s requirement we can supply different queues. This includes maximum queue & minimum queue in any interval, Average queue length, Queue at the start of Green phase and Queue delay surveys etc. We even have experience of tracking the queue back from one exit of the motorway to the other using multiple cameras.
Before the traffic signal turns green for one or all legs on an intersection, typically this involves queue management techniques by recording the number of vehicles in a queue. Side by side It also involves the recording of the volume of each lane queue depending on the length of the queue, and by taking into account the number of lanes that exist.